Help
What is DAVI?
DAVI (Domain Architecture clustering and Visualization) is a web server for clustering and visualizing protein domain architectures. It accepts the output of most used domain architecture prediction tools such as BMC (best match cascading), DAMA (Bernardes et, al. 2015) and dPUC (ochoa et, al. 2011). Nevertheless, it is also possible to run those tools by inputting FASTA sequences or domain hits. DAVI provides a set of visualization features, including domain architecture groups, compact view, statistics and the possibility of exporting data in several formats.
Quickstart
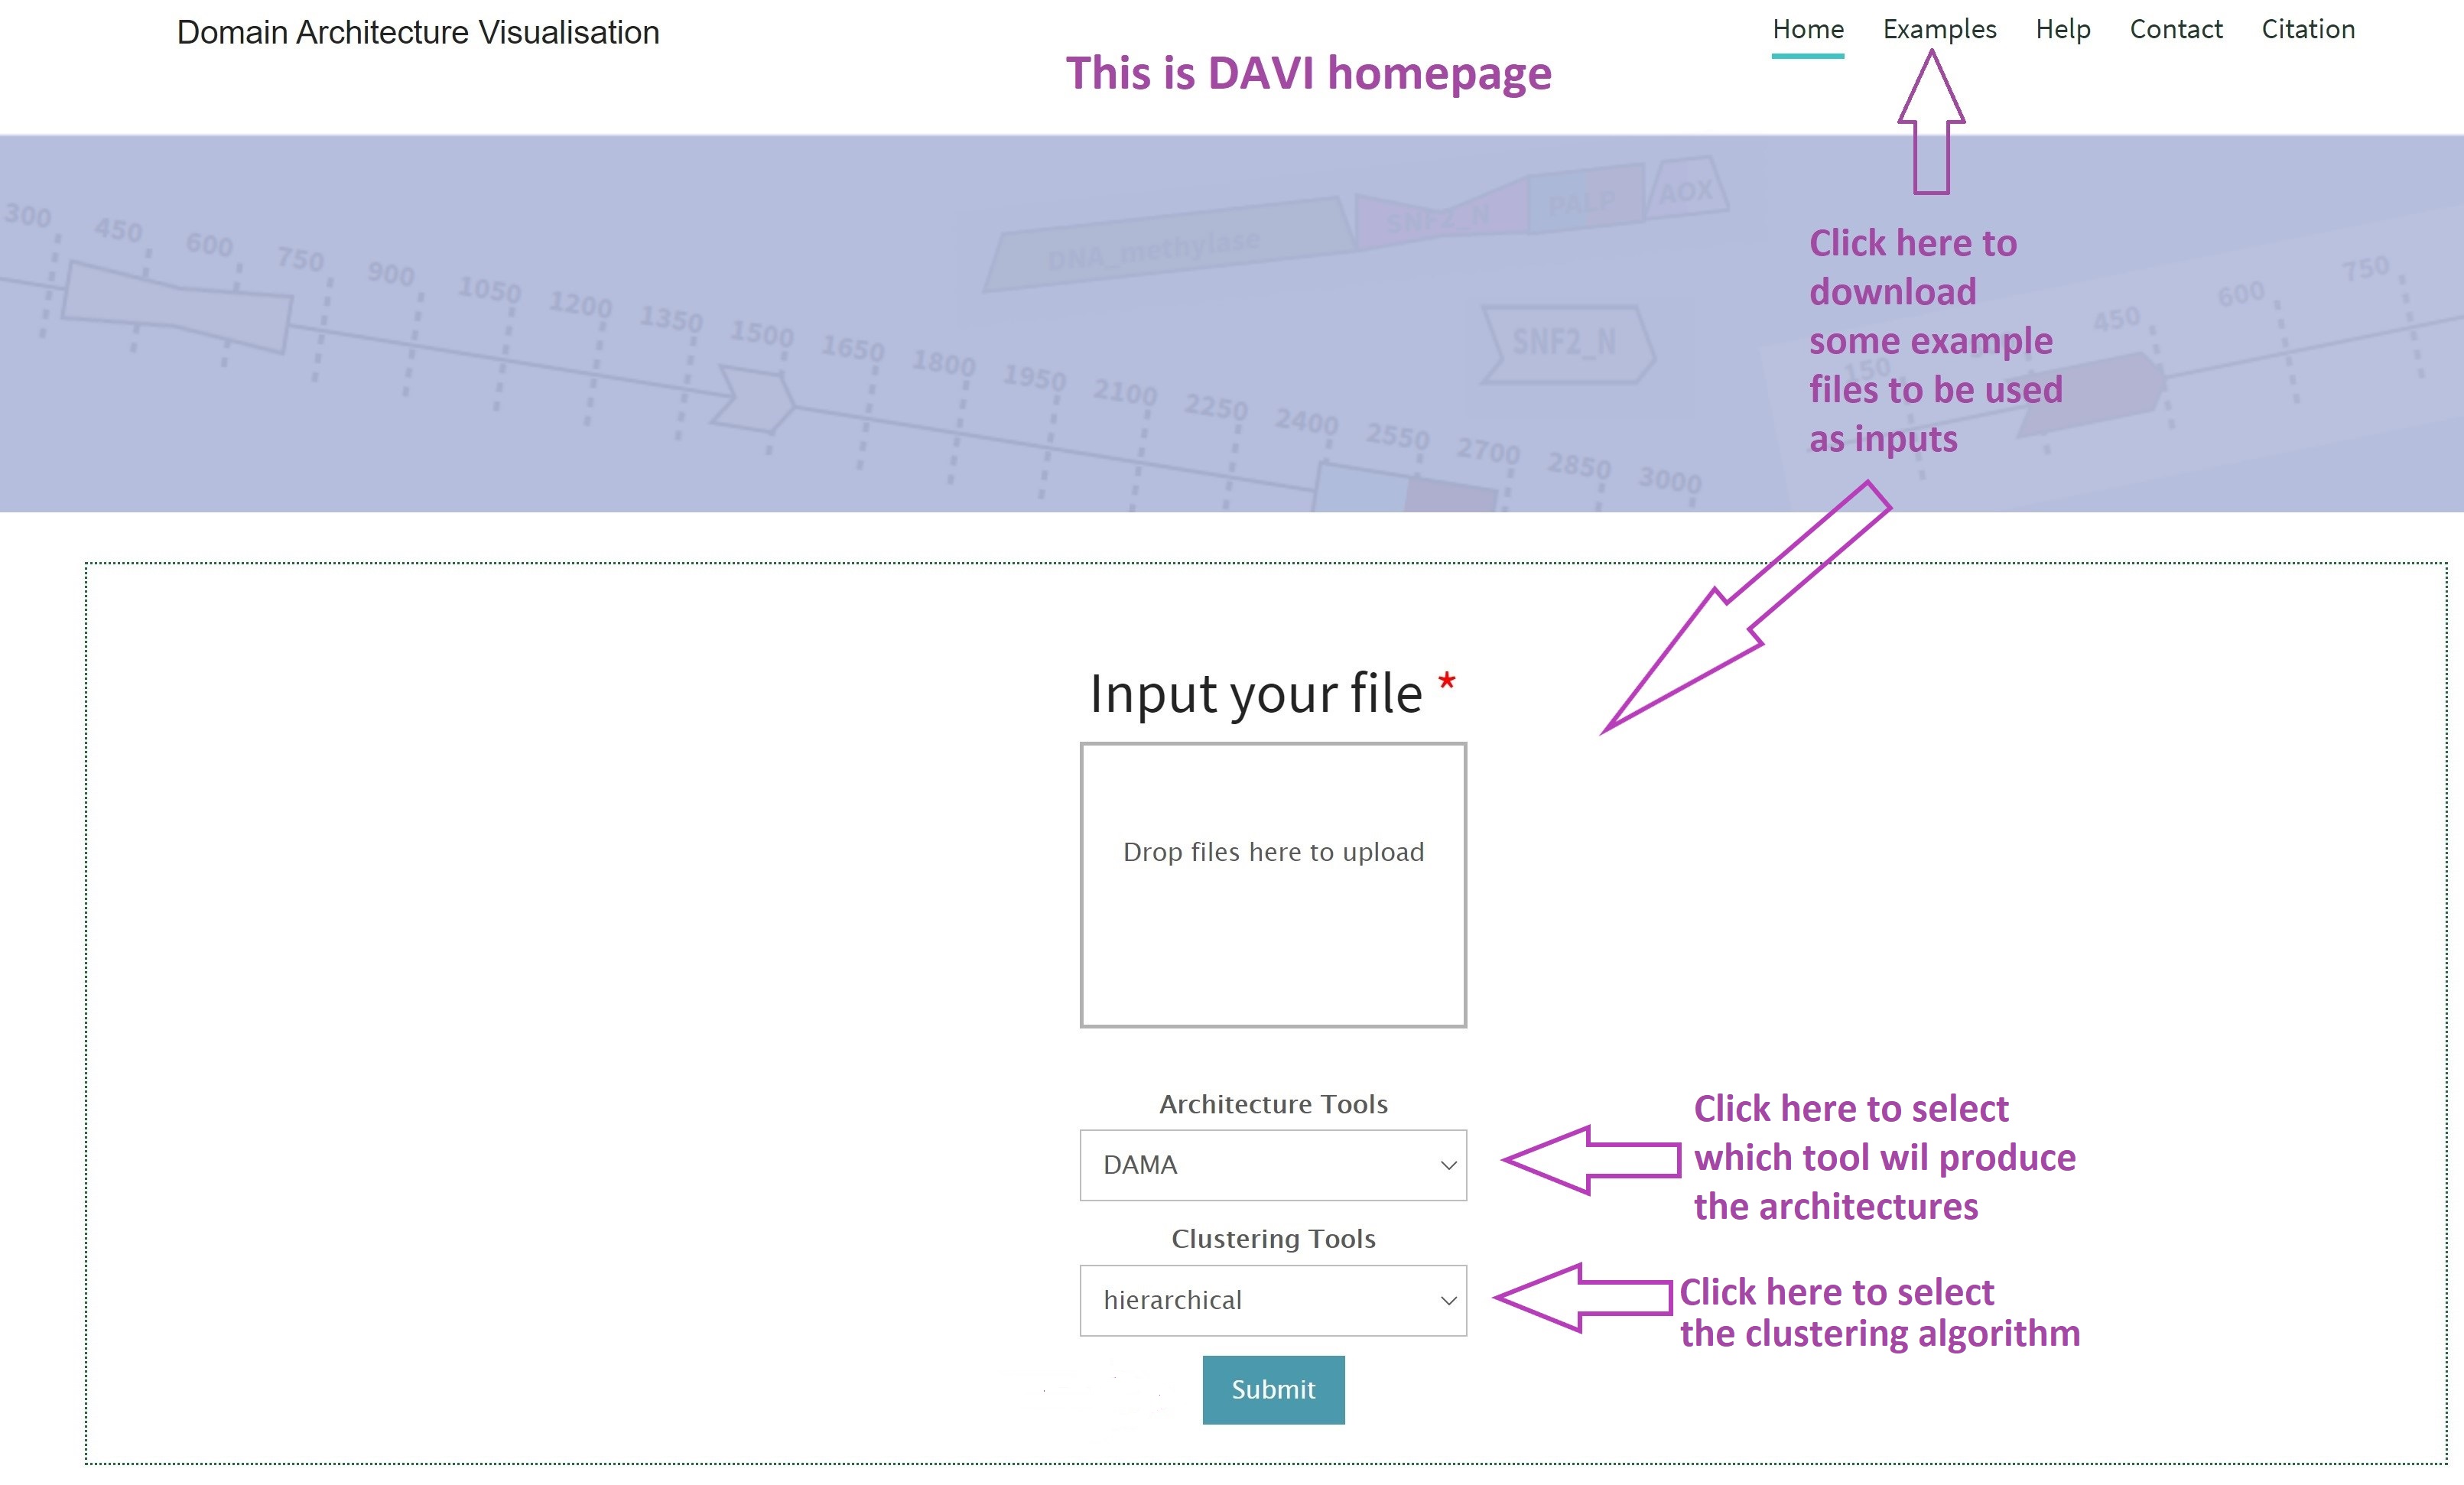
How to use it?
Provide protein sequences in FASTA format, hmmscan outputs, or domain architectures obtained by any tool.
Interpreting the results
DAVI has four visualization modules implemented for different objectives: standard view, compact view, statistics and export files.
Standard view
It displays groups of proteins with similar domain architectures. Initially, each group displays only a representative protein, but you can expand and navigate to explore all protein architectures.
Compact view
It offers a condensed view of protein domain architectures, where only domain order is displayed, and protein lengths are masked..
Statistics
It displays quantitative information about your data, such as the number of obtained groups, sequences, mean of domain per protein and number of distinct domains.
Export
You can export domain architectures in excel or SVG formats